
|
|

|

|


Normal distributions are a family of distributions that depends on two parameters: the mean and the variance. The positive square root of the variance is called the standard deviation.

The standard normal distribution (with mean 0 and stardard deviation 1) is the simplest case:
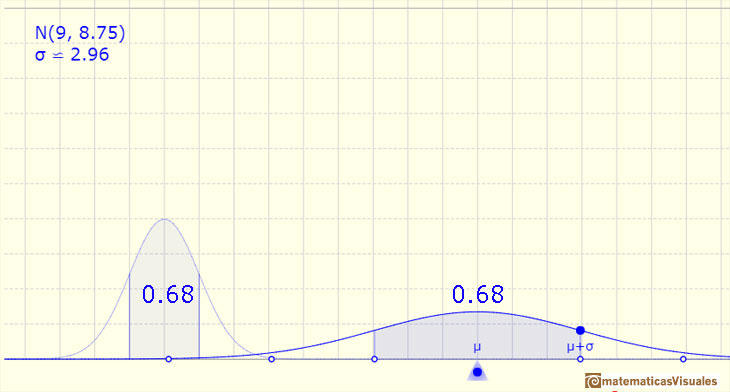
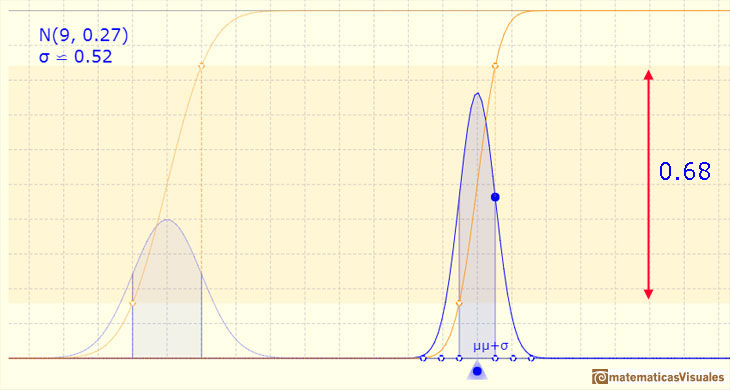
One important property of normal distributions is that if we consider intervals centered on the mean and a certain extent proportional to the standard deviation, the probability of these intervals is constant regardless of the mean and standard deviation of the normal distribution considered.
For example, if we consider an interval centered on the mean with amplitude one standard deviation up and down, the probability is about 0.68.
This value is the area below the density probability function (the bell curve) between these two values of the variable:
If we consider the standard normal distribution:
In the general case of a normal distribution:
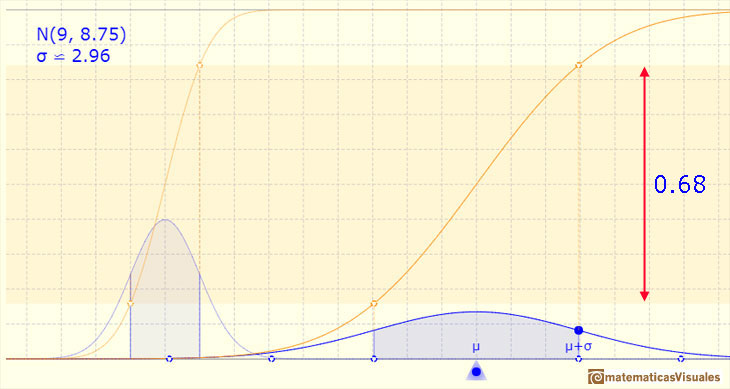
The method we can use to calculate this area is using the (cumulative) distribution function (the area and the probability is the substraction of two values):
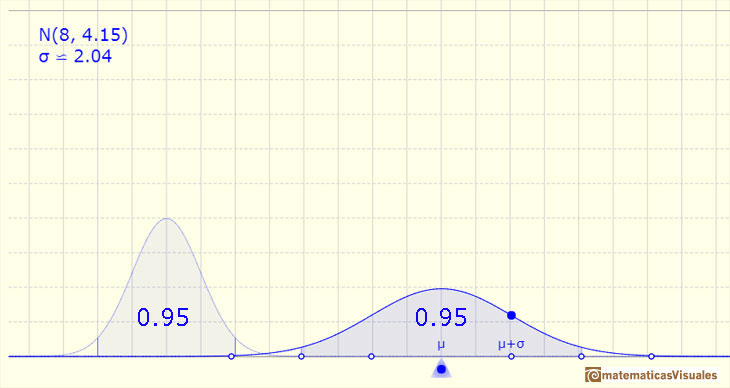
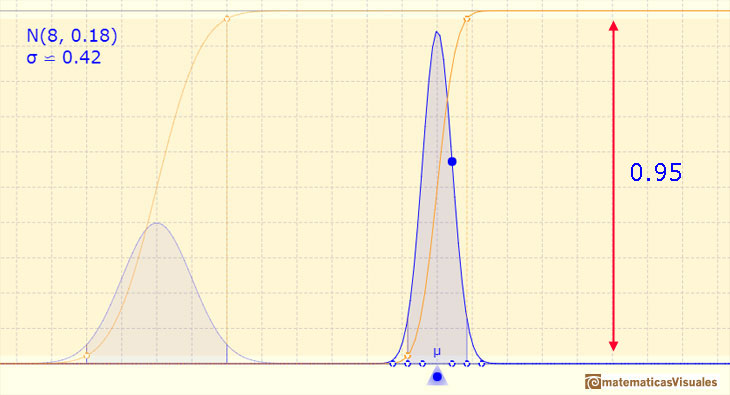
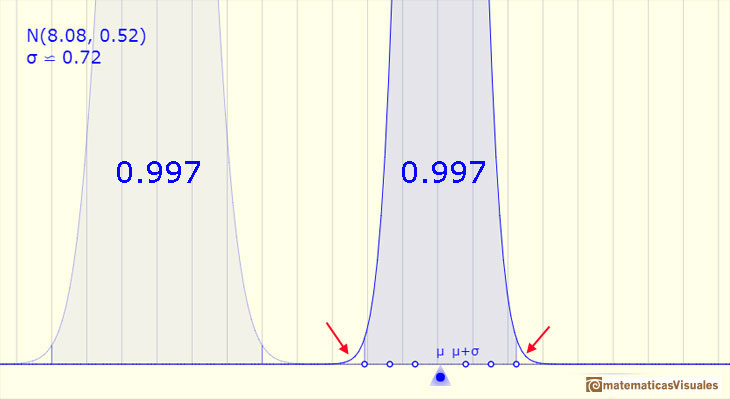
We can see that this value does not change if we change the mean an the standard deviation of the normal distribution:
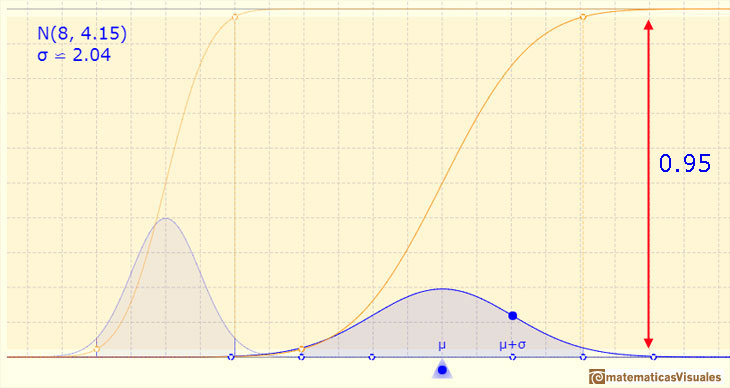
If the amplitude is two standard deviations up and down, the probability is 0.955.
If the amplitude is three standard deviations up and down, the probability is 0.997.
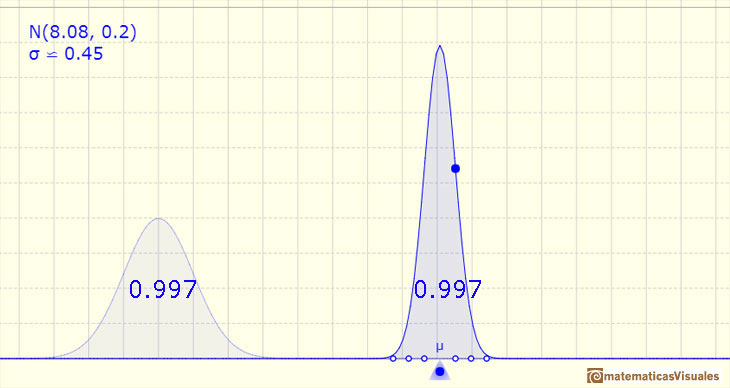
These probability values (0.68, 0.95 and 0.997) for intervals of one, two, and three sigma around the mean of a normally distributed variable are often used in statistical calculations.
We can modifying the parameters of the normal distribution.
The mean is represented by a triangle that can be seen as an equilibrium point. By dragging it we can modify the mean.
Dragging the point on the curve (which is one of the two inflexion points of the curve) we modify the standard deviation.
We can see the cumulative distribution function and how it change by modifiyng the mean (simple translation) and the standard deviation (reflecting greater or lesser dispersion of the variable).
The red dots control the vertical and horizontal scales of the graphic.
REFERENCES
 NEXT
NEXT

 PREVIOUS
MORE LINKS


